Published 16/10/2023
The Carbon Footprint of a Product (CFP) or Product Carbon Footprint (PCF) refers to the total amount of GHG emissions that are emitted into the atmosphere over the entire lifecycle of a product (which can be a good or a service). The lifecycle of a product begins when raw materials are obtained or when natural resources are generated, and finishes at the end-of-life treatment of the product. We already know that just the manufacturing and production sectors already account for 25% of the world’s carbon emissions, consuming 54% of the world’s energy sources (World Economic Forum). And we know that one of the first steps “towards reducing the carbon footprint of the manufacturing industry is understanding the…PCF” (WEF).
There are many benefits to measuring the carbon footprint of a product, and this is now becoming an obligation all over the world. This means that it is not only necessary to quantify the carbon footprint of your products, but also to ensure that these measurements are accurate. To name only a few examples, inaccurate measurements can lead to penalties, wasted time and money, and lack of trust from consumers. In the early 2000s, when the CFP was fairly new, the overall aim was for companies to be able to calculate it. Now that the low-carbon transition is widespread, it is no longer enough to simply have a CFP. You must prove that it's accurate. Engineers and the general public have become increasingly proficient in this area, and so companies' CFPs are being scrutinized.
In this article, we explain why you need to improve the accuracy of your CFP measurements and how you can take action to achieve better precision in these calculations and reports.
TABLE OF
CONTENTS
01
02
01
Why Measure the Precise Carbon Footprint of Your Products?
Soon to be an Obligation
Worldwide, the obligation to report greenhouse gas (GHG) emissions has expeditiously increased. This includes the reporting of significant contributors to these emissions, such as the lifecycle of products.
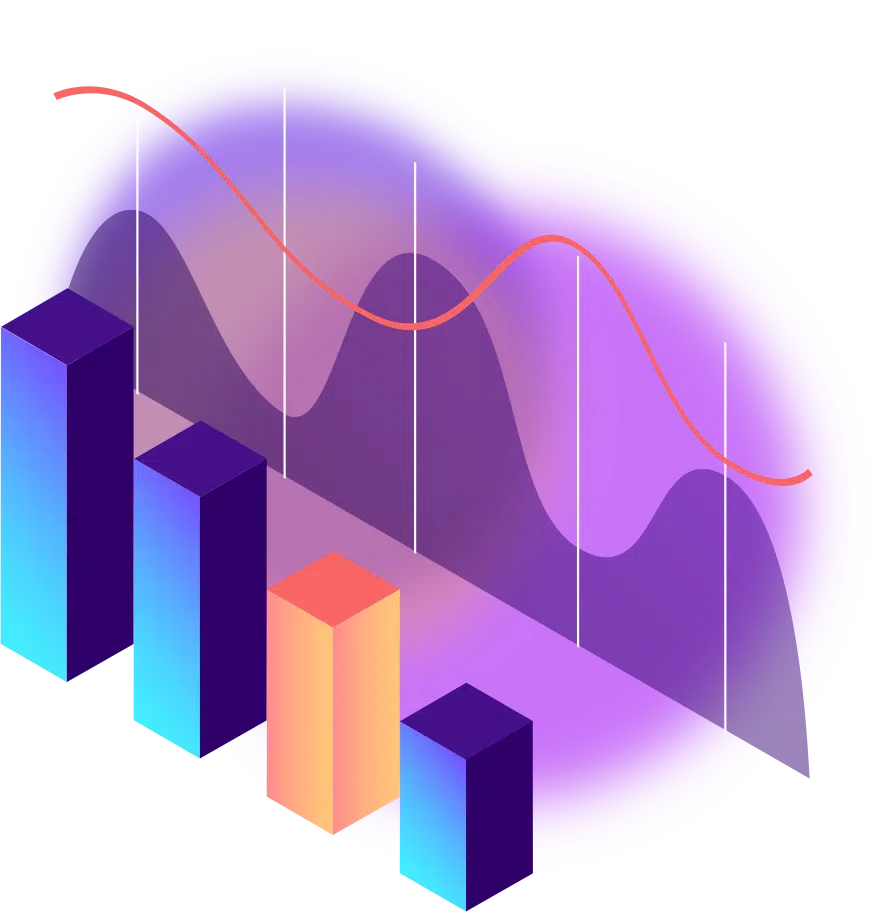
As part of this the acceleration of regulations concerning the carbon values of products, and overall annual carbon assessments for organizations and enterprises, we are also seeing obligations move from reporting using general data to more precise data. Up until now, the norm has been to make calculations per year for organizations, or on a certain product sample for life-cycle analyses. But these methods tend to mask seasonal variations, notably in the carbon content of electricity, and the vagaries of supply markets. This means that the next step will be to make more accurate measurements, down to the carbon value of specific batches.
Different batches will have different carbon values depending on multiple factors. For example, if you are using more solar energy one day, the carbon value of the batch will be lower, due to the increased amount of renewables in the energy mix. Here, the idea is that producers will eventually be required to measure carbon emissions in real-time, and then use that data to calculate a veritable value, that can be put down to a product. In other words, to target effective carbon reduction measures more precisely, it is necessary to calculate the carbon footprint in real time.
"Reported information can be hard to compare from company, and users of the information, such as investors, are often unsure whether they can trust it.
Problems in the quality of sustainability reporting have knock-on effects…Investors increasingly should be made aware about the impact of companies on people and the environment and their plans to reduce such impacts in the future. This knowledge will help them to meet their own disclosure requirements under the Sustainable Finance Disclosure Regulation (SFDR). More generally, if the market for green investments is to be credible, investors need to know about the sustainability impact of the companies in which they invest. Without such information, money cannot be channelled towards environmentally friendly activities."
European Commission, Questions and Answers on the Adoption of European Sustainability Reporting Standards.
For example, the European Union's Corporate Sustainability Reporting Directive (CSRD) will mandate companies to produce such reports with adequate precision for the 2024 financial year by the year 2025. The EU implemented this directive because “there is ample evidence that the sustainability information that companies current report is not sufficient.”
To Improve Competitivity
By having more accurate measurements on the carbon score of your products, it is easier to identify areas for improvement, and to reduce their environmental impact. For example, the design of the products themselves, or outdated equipment, can be improved. Energy efficiency improvements and optimizations that have been put in place can be translated more easily into the carbon score of products when there is more accuracy. These can be lost when the carbon score is calculated using average, and less specific data. In other words, when energy performance measures have been put in place, using less accurate data can result in a higher CFP measurement than is really the case.
What are the 3 Scopes and how do they fit in a decarbonization roadmap?
Now that many enterprises have managed to measure and reduce their scope 1 and 2 emissions, the next step is to really work on scope 3 emissions. One of the first actions you can take is to change your suppliers and work with those who have lower emissions on their own scopes 1 and 2. Some companies even go as far as funding the implementation of an Energy Management and Optimization System for their suppliers so that they have the tools to reduce their own emissions on scope 1 and 2, and thus reduce the scope 3 emissions of the parent company. This is especially important because, according to CDP, scope 3 emissions account for 75% of company greenhouse gas emissions on average.
All of these elements will give you more competitiveness if organizations are looking to reduce their carbon emissions by choosing suppliers with more sustainable batches. Even the GHG protocol has stated that, “in general, companies should seek activity data or emissions data from suppliers that are as specific as possible to the product purchased from the supplier.”
Getting ahead of the game as a producer, will hence also give you a competitive advantage in the B2C market. To give you more of an idea, according to McKinsey, total consumer spending “accounts for over $14 trillion annually and two-thirds of the US GDP.”
Benefits for Final Consumers
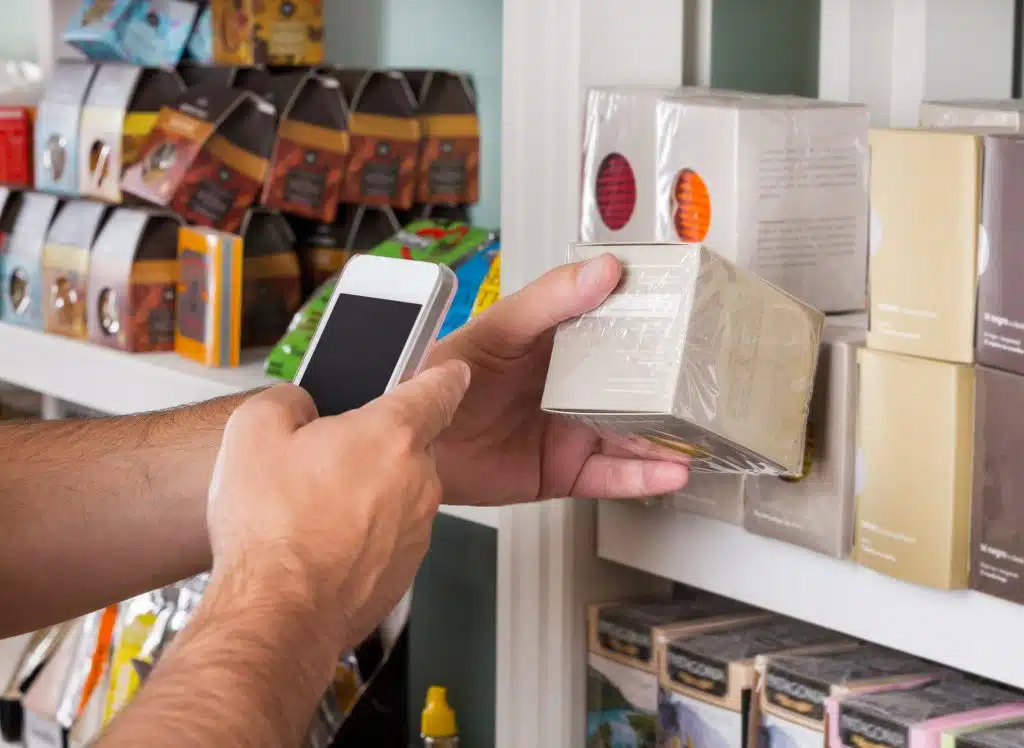
While it is usually bigger organizations who have the most significant carbon footprint, smaller companies and everyday consumers also want to make a difference. By having more transparent carbon data on products which is also more accurate, consumers can make the most informed decisions to reduce their own impact on the environment. Today, carbon measurements for individuals are particularly abstract and usually inaccurate.
02
How to Improve the Accuracy of Measurements
Assess and Refine the Quality of Your Data From the Beginning
If you make all your measurements and calculations using low quality data, and there is a significant difference in emissions estimates when data quality is improved, there is a risk that your company would be obliged to recalculate base emissions using the new data sources. This leads to a lot of lost resources. For this reason, it is better to quantify the carbon footprint of your products with the highest level of accuracy from the beginning.
This is an especially high risk for scope 3 calculations, where companies have been obliged to use low quality data because of lack of availability. For instance, instead of using real-time data which measures consumption at a higher granularity with more accuracy, many companies have been making estimates using invoices. The GHG Protocol guidelines say that the 3 steps of collecting data, assessing its quality, and making improvements to it is an iterative process. When selecting data sources, companies should “first apply data quality indicators and assess data quality, then review the quality of the collected data, using the same data quality assessment approach...”
As a supplier, for example, it is important to improve the quality and transparency of your carbon footprint data, to increase trust of your clients who want to decrease their own scope 3 calculations.
When improving data quality, companies should make priorities where activities have:
low data quality
high emissions
6 Energy Savings Tips for Industrials

Increase the Ratio of Primary Data
Primary data should be used as much as possible when quantifying the CFP. This is data that comes directly from your activities. This is contrary to secondary data, also known as “proxy data”, which is not specific to the activity relating to emissions of your products.
For example, instead of using approximations and average values taken from invoices (secondary data) to measure the carbon impact of your product, which is what major carbon assessments often do to fill in data gaps, digital tools be used to improve accuracy (primary data). Solutions such as an EMOS can help companies collect precise, real-time data, relating to the energy consumption of activities.
A higher ratio of primary to second data is highly recommended by the GHG Protocol along all scopes: “When collecting emission factors from suppliers it is recommended that companies also request information relating to the ratio of primary and secondary data used to calculate the emission factor. This information will provide transparency around how much primary data the supplier used to calculate the emission factor for its product. As suppliers become more sophisticated in GHG assessments, the percentage of primary data used to calculate emissions factors for their products is likely to increase. Collecting information on the ratio of primary and secondary data will enable this ratio to be measured and tracked over time.”

Primary Data and Secondary Data: What is the Difference?
“Primary activity data may be obtained through meter readings, purchase records, utility bills, engineering models, direct monitoring, mass balance, stoichiometry, or other methods for obtaining data from specific activities in the company’s value chain.”
“Secondary data includes industry-average-data (e.g., from published databases, government statistics, literature studies, and industry associations), financial data, proxy data, and other generic data. In certain cases, companies may use specific data from one activity in the value chain to estimate emissions for another activity in the value chain. This type of data (i.e., proxy data) is considered secondary data, since it is not specific to the activity whose emissions are being calculated.”
Use Dynamic Energy Measurements to Obtain Real-Time Data
In the current context of the energy transition, we are seeing more and more changes that make it ever more important to measure carbon impact data in real time. For example, we have recently seen great fluctuations in the composition of each energy mix. In Europe, dependence on oil & gas coming from Russia has reduced, and there has been a reduced ratio of nuclear energy because of plant renovations in France.
This means that in reality, the carbon value of a product will change by day. For instance, if you buy energy on the network, or if you produce your own energy, the carbon cost will be different each day. This is because you have not used the same energy from one day to another. One batch might be produced using green energy one day, but not the other. Accurate data on these changes can no longer be measured by reading the meter before and after producing a batch of product. This dynamic carbon content of electricity, and so of the final product, will increase in the future due to the strong increase of renewable energies in the production mix.
Formerly, it may have sufficed to measure carbon emissions data annually, because of repetitive and regular processes to measure carbon value of each product batch, powered by the same energy supplier. Now, these calculations need to be more dynamic. This requires more advanced software, such as a digital EMOS, which can automatically collect and import the energy data of your product, external influencing data such as weather changes and information about your energy mix. Such tools can also make automatic calculations such as KPI attainment information and consumption predictions which can help you organize your processes and budgets, as well as inform your customers of the expected carbon value of each batch. Experts in digitalization are also required for the implementation of new quantification procedures.
Opt for Digital Tools
Using digital tools can not only improve accuracy when quantifying GHG emissions of products. It also makes the process much easier. This will help you save more energy, time, and resources to invest in other areas of importance.
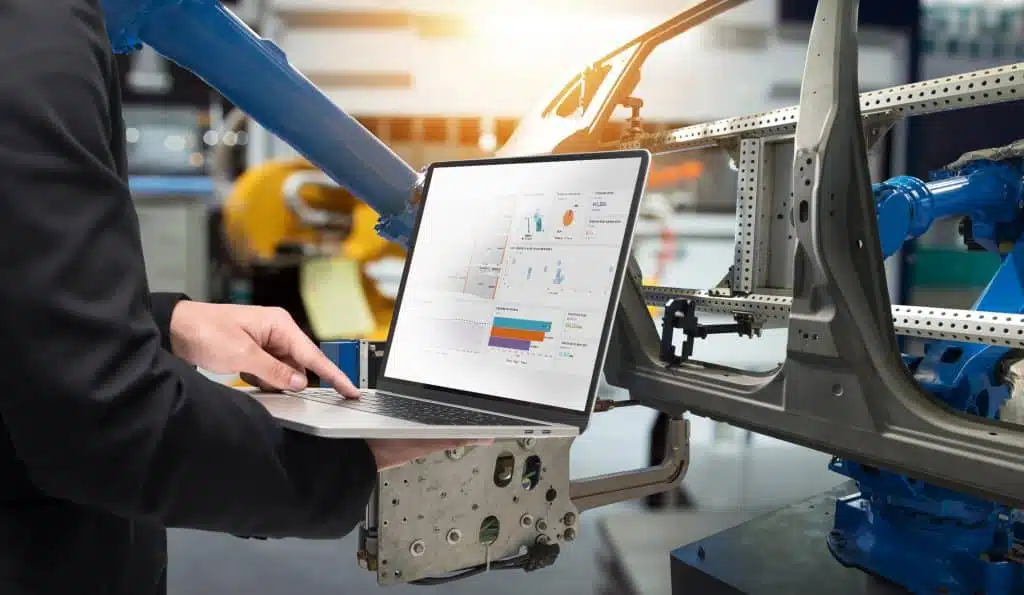
For example, an Energy Management and Optimization Solution (EMOS) is a powerful solution that can automate and facilitate the extraction of real-time energy data, as well as facilitate calculations. Users of an EMOS can program calculations so that they are done automatically in relation to batches. Such a solution can also easily centralize all data in a way that is easy to access and understand. These benefits can decrease the risk of human error and justify calculations.
Often, when an external EMOS is implemented, this is accompanied by improvement recommendations from experts, so that users can select the most pertinent data and know how they can improve efficiency in processes.
Want to know how an EMOS can help you accurately measure the carbon footprint of your products?


